Article type: Systematic Review
Article title: Alpha-Synuclein Seed Amplification Assays in Parkinson’s Disease: A Systematic Review and Network Meta-Analysis
Journal: Clinics and Practice
Year: 2025
Authors: Jamir Pitton Rissardo, Ana Leticia Fornari Caprara
E-mail: jamirrissardo@gmail.com
ABSTRACT
Introduction and objective: Assessment of α-synuclein (αSyn) seed amplification assays (αSyn-SAA) accuracy in distinguishing Parkinson’s disease (PD) from controls using cerebrospinal fluid (CSF), blood, skin, extracellular vesicles (ECV), saliva, olfactory mucosa (OM), gastrointestinal tract (GIT), and submandibular gland (SMG). Methodology: PubMed was searched for articles from 2010 to January 2025. The quality assessment used robvis. Diagnostic values with a 95% confidence interval (CI) were obtained. Z-test, Wald CI, and ANOVA were performed. Diagnostic odds ratio (DOR) was used. Results: αSyn-SAAs showed strong diagnostic performance in distinguishing PD from controls across various tissue and fluid types. Overall, αSyn-SAAs demonstrated high sensitivity (86%) and specificity (92%). Among all biomatrices, CSF, skin, blood, and ECV yielded the highest diagnostic accuracy, with sensitivity and specificity approaching or exceeding 90%. In contrast, saliva, oral mucosa, and gastrointestinal tract samples showed more modest sensitivity, though specificity remained relatively high. ECV, CSF, skin, and blood matrices also demonstrated the highest DOR, supporting their potential clinical utility. Conclusions: ECV and blood warrant priority in αSyn-SAA for high accuracy and minimal invasiveness, while GIT, OM, and oral samples show limited utility; saliva and SMG need refinement.
Keywords: alpha-synuclein; synucleinopathy; biomarker; biofluid; protein misfolding cyclic amplification (PMCA); real-time quaking-induced conversion (RT-QuIC).
Full text available at:
DOI
Citation
Rissardo JP, Fornari Caprara AL. Alpha-Synuclein Seed Amplification Assays in Parkinson’s Disease: A Systematic Review and Network Meta-Analysis. Clin Pract 2025;15(6):107. https://doi.org/10.3390/clinpract15060107

Figure 1. PRISMA flowchart for the identification of included studies.

Figure 2. Quality assessment of all eligible studies based on robvis.
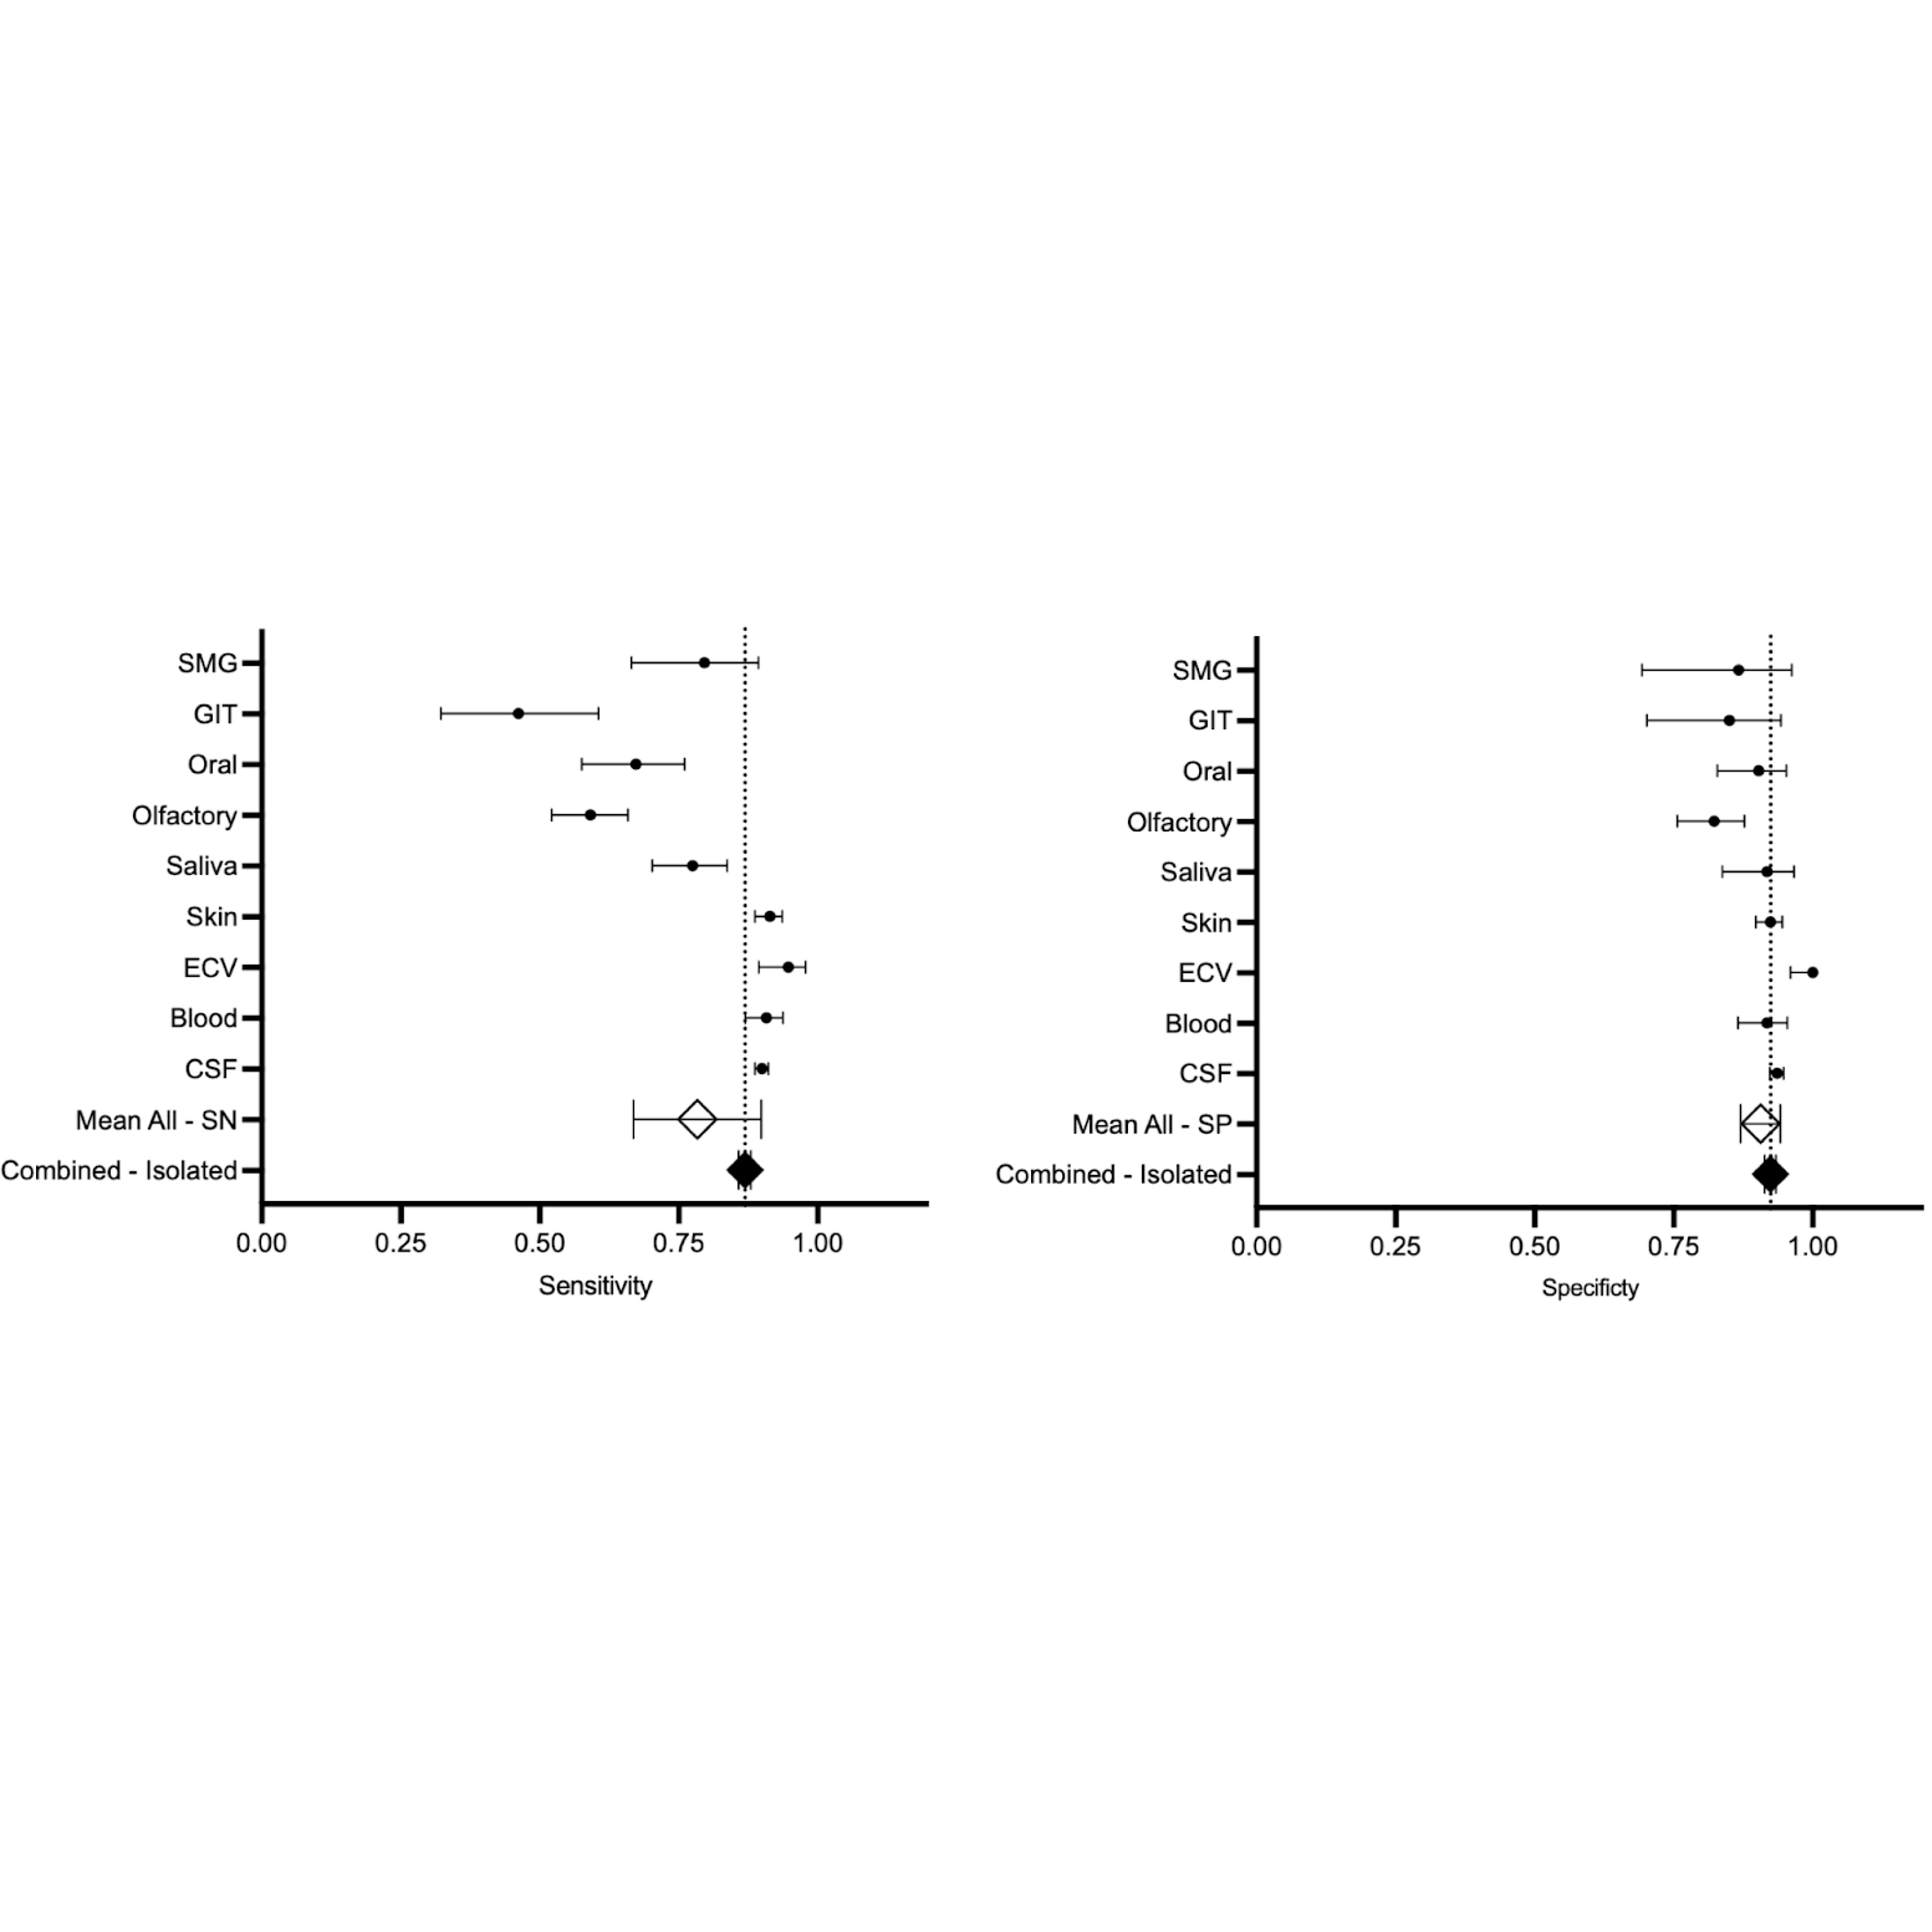
Figure 3. Sensitivity and specificity of all biomatrices investigated for alpha-synuclein in diagnosing Parkinson’s disease. Abbreviations: CSF, cerebrospinal fluid; ECV, extracellular vesicle; GIT, gastrointestinal; SMG, submandibular gland; SN, sensitivity; SP, specificity; transparent diamond (◇), pooled population; black diamond (◆), unique population.

Figure 4. Summary receiver operating characteristic curve of αSyn-SAAs for the diagnosis of Parkinson’s disease versus non-neurodegenerative neurological control (non-synucleinopathies).
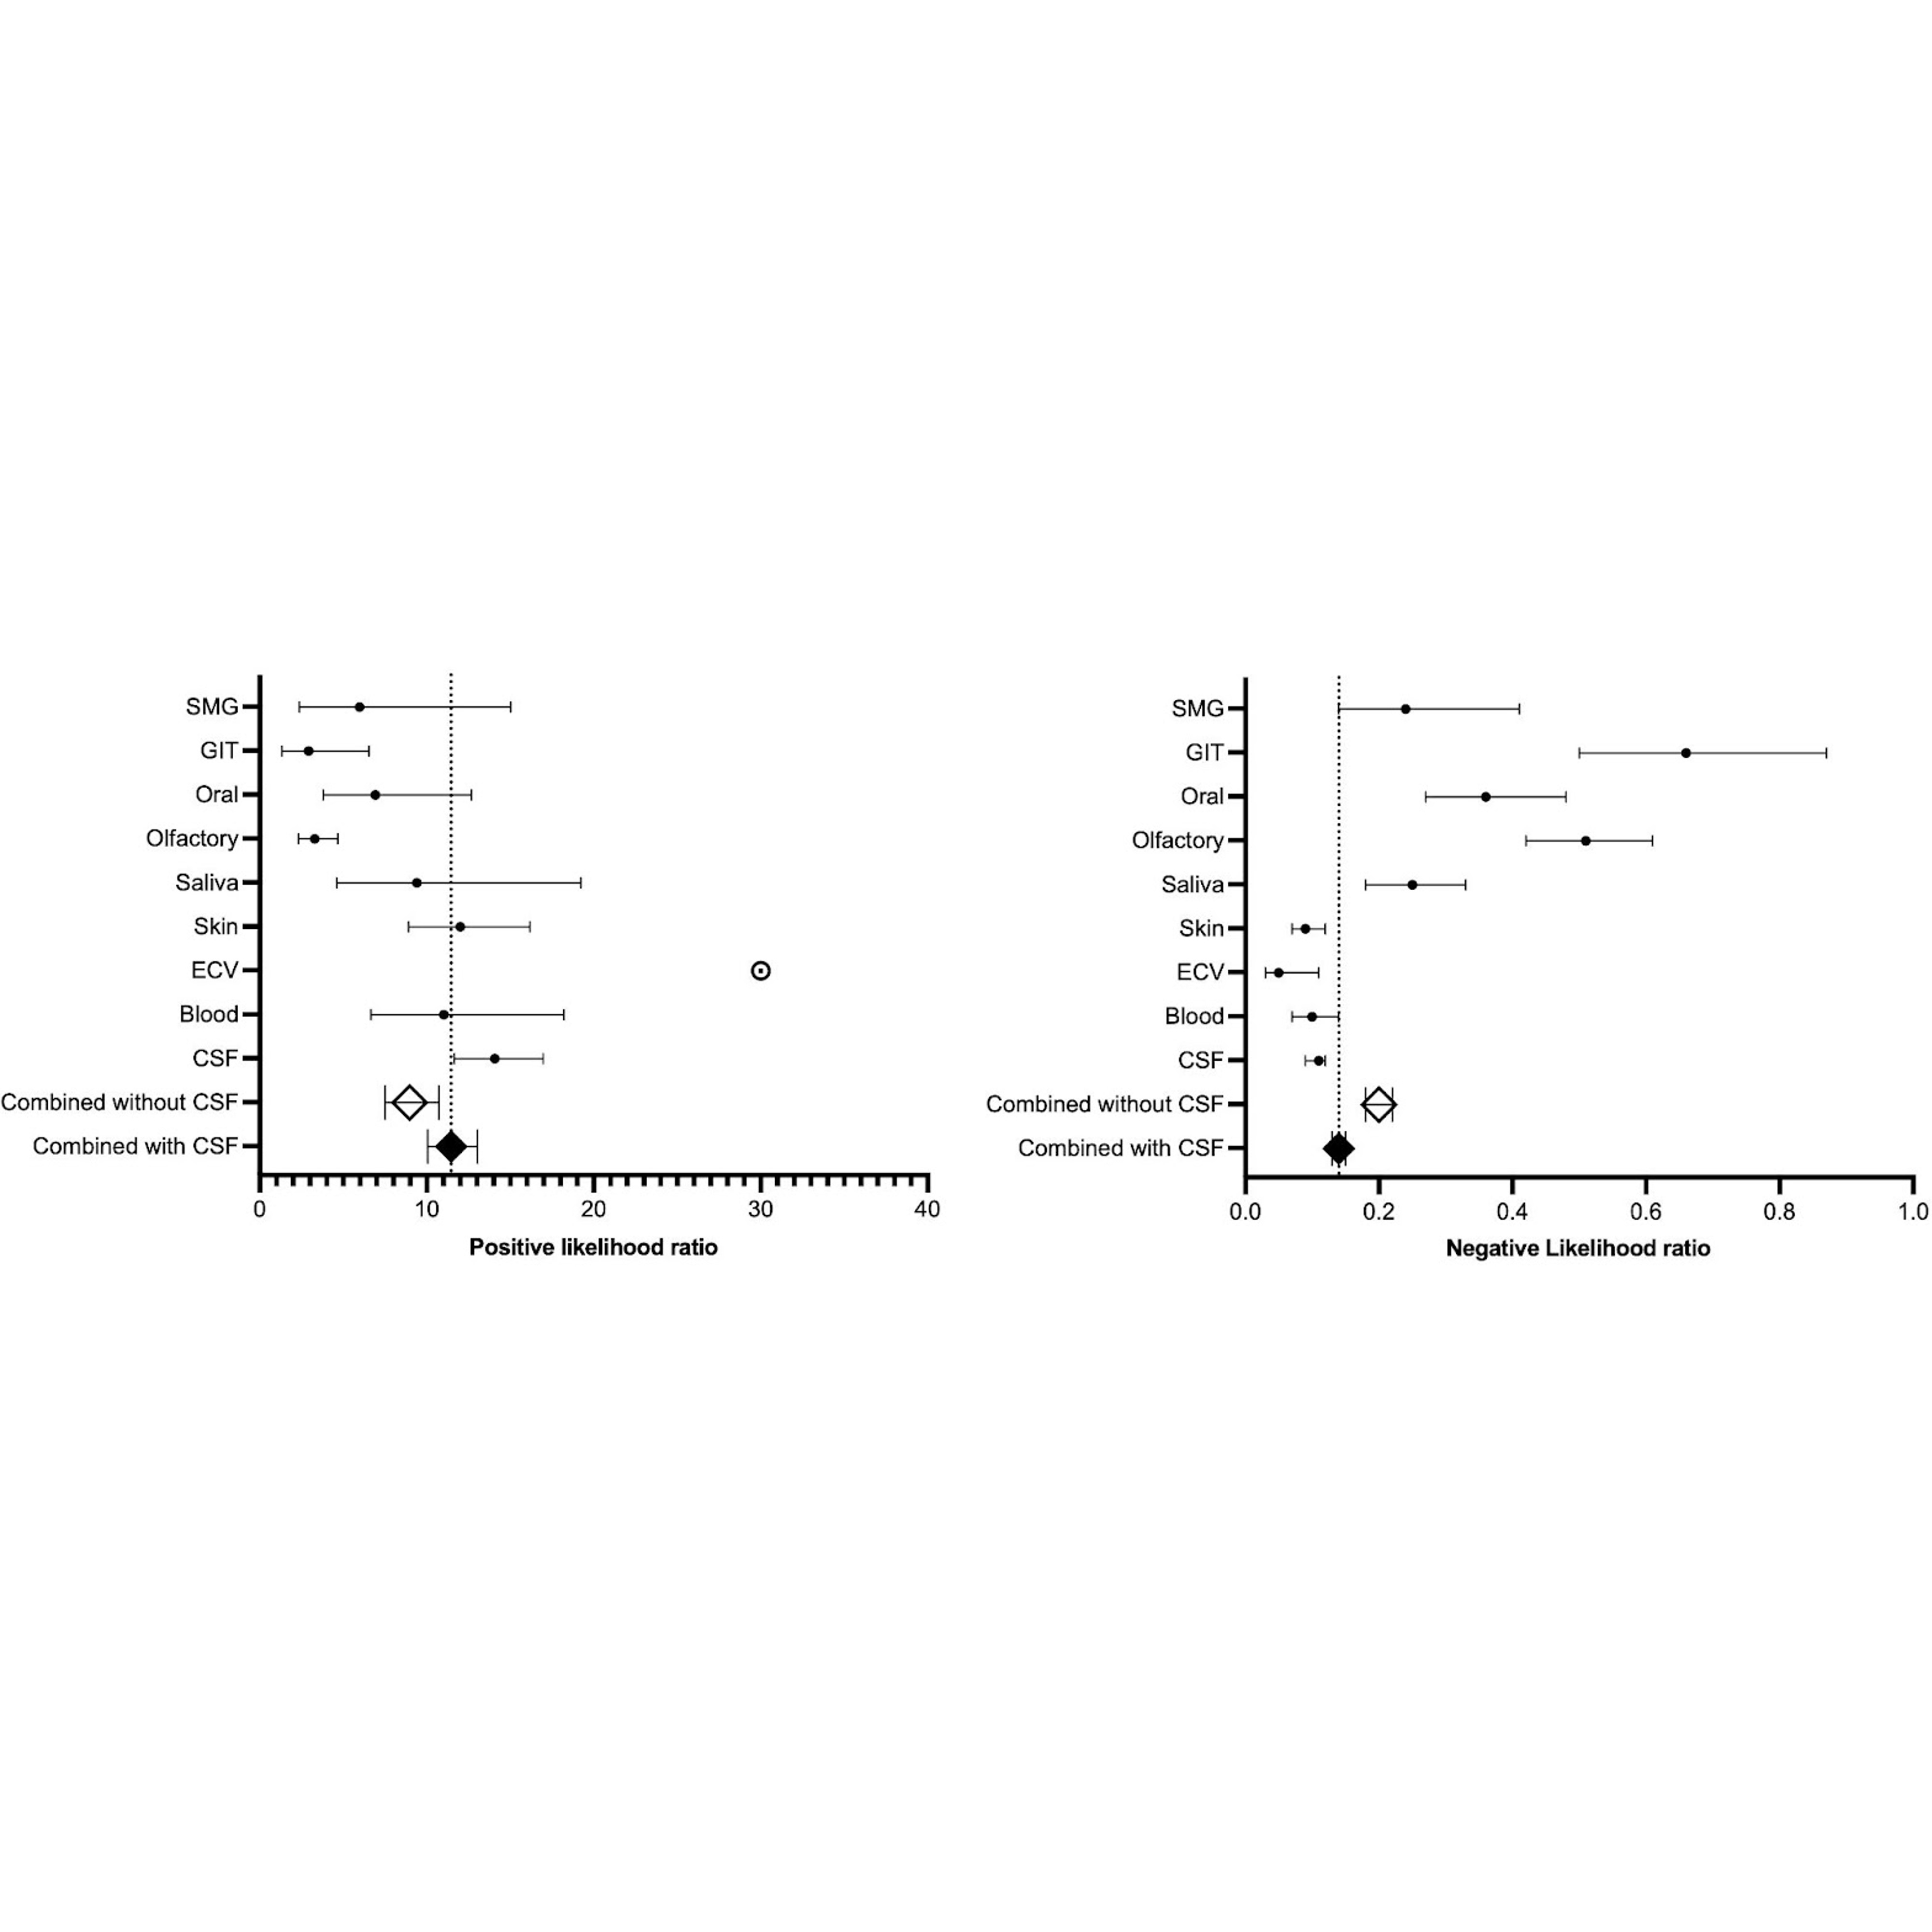
Figure 5. Forest plot of the positive and negative likelihood ratio of the different biomatrices. Abbreviations: CSF, cerebrospinal fluid; ECV, extracellular vesicle; GIT, gastrointestinal; SMG, submandibular gland. The white ball with the black dot is to represent the ∞ of the likelihood ratio of ECV.

Figure 6. Network plot of the sensitivities. Abbreviations: (A) cerebrospinal fluid; (B) blood; (C) extracellular vesicles; (D) skin; (E) saliva; (F) olfactory; (G) oral; (H) gastrointestinal tract; (I) submandibular gland.

Figure 7. Network plot of the specificities. Abbreviations: (A) cerebrospinal fluid; (B) blood; (C) extracellular vesicles; (D) skin; (E) saliva; (F) olfactory; (G) oral; (H) gastrointestinal tract; (I) submandibular gland.

Figure 8. ROC curve plot of RT-QuIC and PMCA tests. Note: Test 1, CSF PMCA; Test 2, CSF RT-QuIC; Test 3, Skin PMCA; Test 4, Skin RT-QuIC; Test 5, GIT PMCA; Test 6, GIT RT-QuIC; Test 7, Combined (CSF, skin, GIT) PMCA; Test 8, Combined (CSF, skin, GIT) RT-QuIC.

Table 1. Types of biospecimens for alpha-synuclein seed amplification assays in Parkinson’s disease.

Table 2. Sensitivity and specificity of biomatrices for diagnosing Parkinson’s disease.

Table 3. The results of network meta-analysis based on specificity.

Table 4. Comparison between RT-QuIC and PMCA.